Exporting data from Apple's iOS Health app 📱
Back in 2015 when Apple released the iPhone 6S, they added a new chip that let the phone measure step counts continuously without running down the battery. I bought an iPhone 7 about a year ago and have been curious about my step activity since then. I always assumed I’d be able to export my data from the Health app but only recently – after noticing a relationship between my daily step count and the weather in Iowa – looked into how to do just that.
This post walks through how to export raw data from the iOS Health app and then demonstrates a simple analysis of the step count data in Python. You can find the code for this post in my GitHub repo.
Exporting the health data
Apple makes it pretty easy to export raw data from the Health app. You’ll find the export button at the bottom of the user profile.
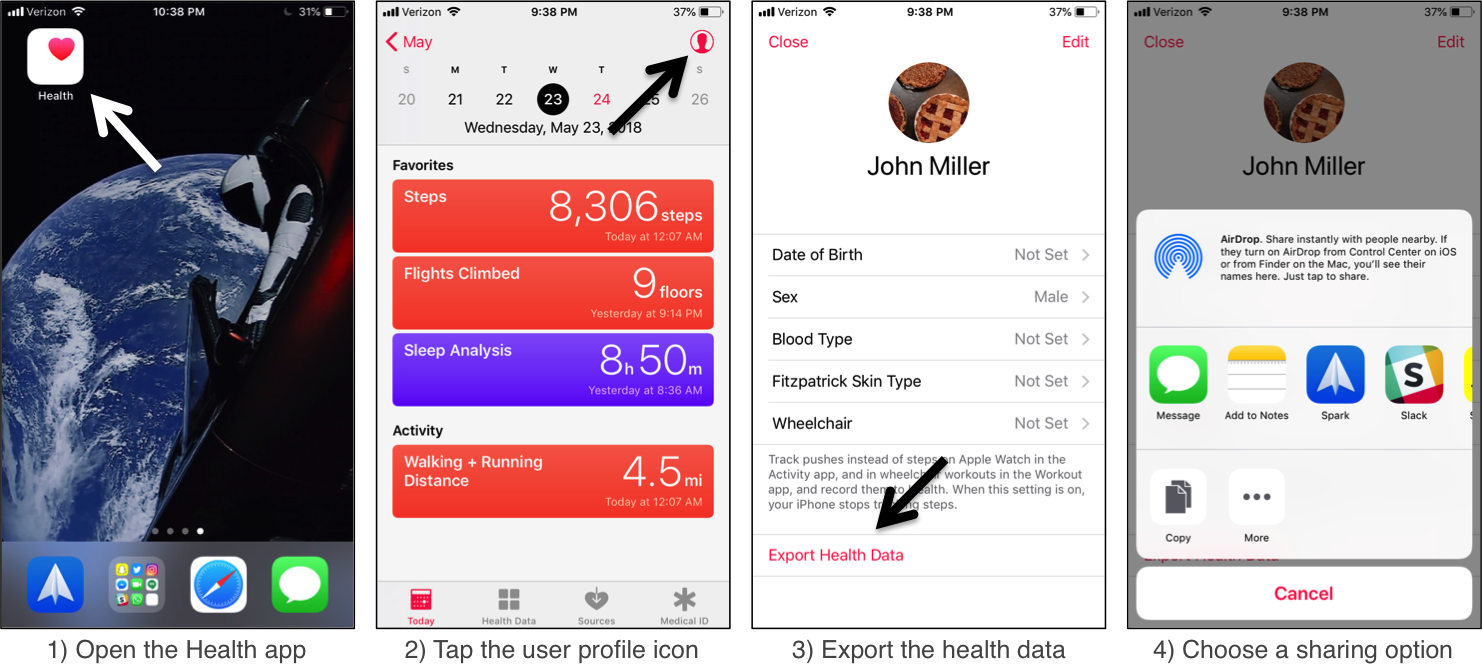
Choose a sharing option that’ll be easiest for you to send the data to your computer. I shared the data into the Notes app which then synced with my laptop over iCloud. The data exports as a ZIP file, export.zip. The ZIP file contains two XML files: export_cda.xml and export.xml.
The export.xml file was the larger of the two (11 MB), so I figured that was the one which contained the health data.
Reading the data in Python
It’s actually a pretty straightforward process to read the raw XML data in Python.
First we load the XML file using Python’s XML library.
# Reads the XML file exported by Apple's Health iOS app
import xml.etree.ElementTree
xDoc = xml.etree.ElementTree.parse('./data/apple_health_export/export.xml')
items = list(xDoc.getroot()) # Convert the XML items to a list
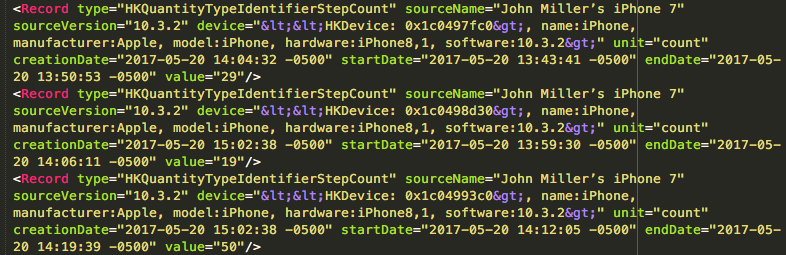
With the XML items stored as a list, we can simply loop through and extract the data we’re interested in. The Health app exports more than just step counts, so we need to specify which type of data we want from the XML file. For an analysis of step counts we’re interested in the "HKQuantityTypeIdentifierStepCount" items, but we could also select "HKQuantityTypeIdentifierBodyMassIndex" or "HKCategoryTypeIdentifierSleepAnalysis" amongst others.
# Loop through the XML items, appending samples with the requested identifier
tmp_data = []
item_type_identifier='HKQuantityTypeIdentifierStepCount' # Desired data type
for i,item in enumerate(items):
    if 'type' in item.attrib and item.attrib['type'] == item_type_identifier:
        # Attributes to extract from the current item
        tmp_data.append((item.attrib['creationDate'],
                         item.attrib['startDate'],
                         item.attrib['endDate'],
                         item.attrib['value']))

# Convert to data frame and numpy arrays
import numpy as np
import pandas as pd
data = pd.DataFrame(tmp_data, columns = ['creationDate','startDate','endDate','value'])
all_step_counts = np.array(data.values[:,-1], dtype=int)
all_step_dates  = np.array(data.values[:,0])
We now have the data we’re interested in: step counts and their corresponding sample times. In my case, with about a year’s worth of data, I had 12,456 samples, or roughly 34 samples per day. I assume the phone isn’t sampling at a constant rate – I’d be curious to know what determines how often it generates a sample in this data file.
Displaying the data
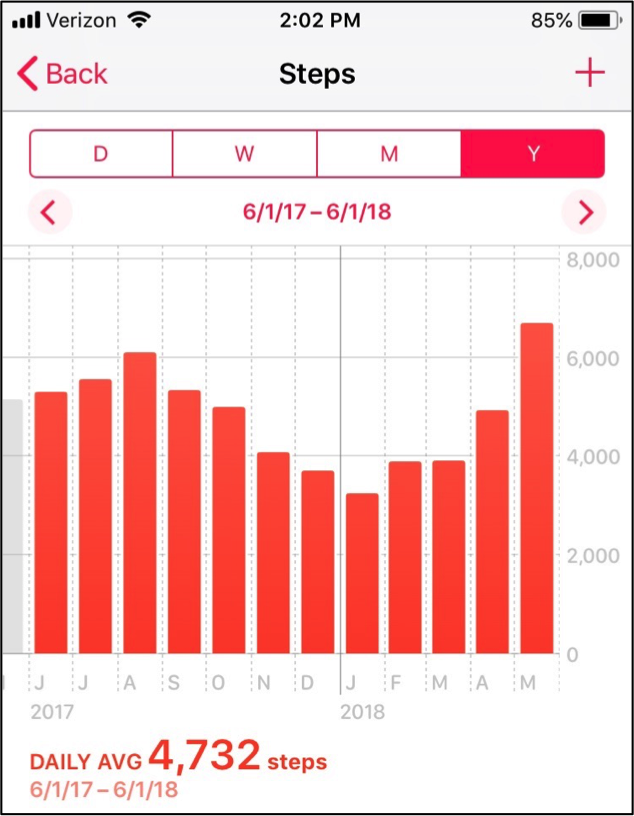
As a sanity check, we can start by recreating one of the graph’s generated by the iPhone.
What happens if we just plot all the raw data from the xml file?
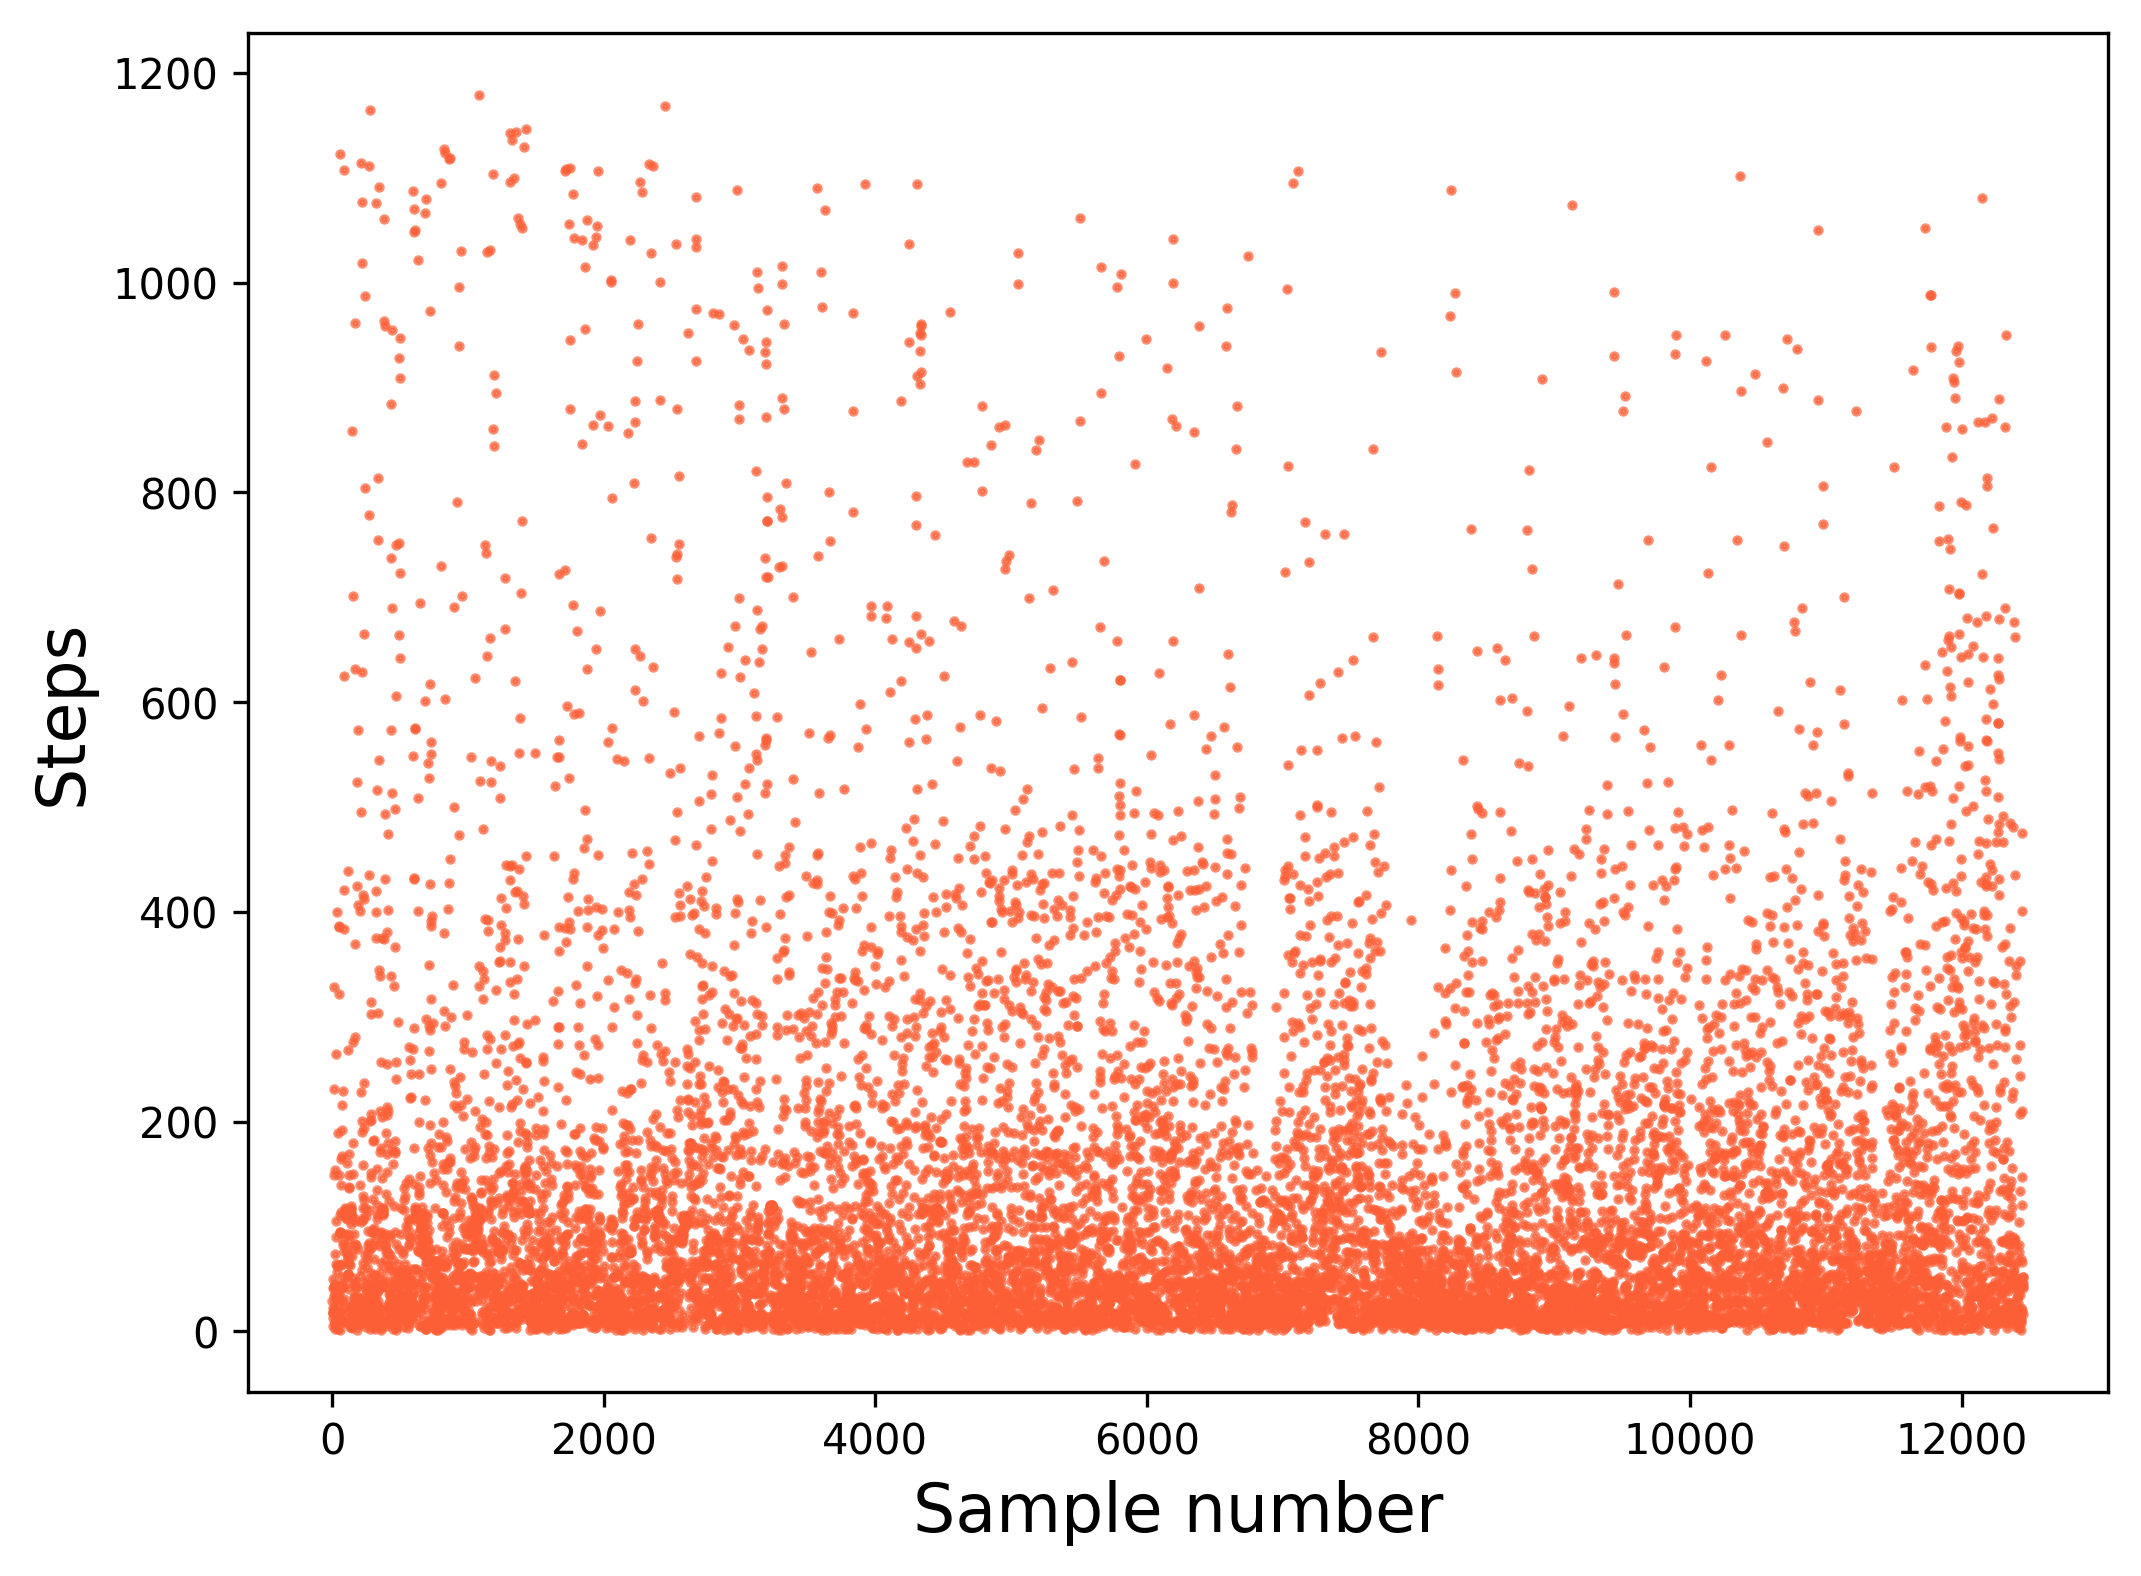
Hmm… that doesn’t look like what we want. What’s going on? Well, obviously, the plot from the iPhone is a bar graph. But even if we plot the raw data as a bar graph instead of a scatter we won’t end up with what we want. The important difference between the two plots is that the iPhone is doing a monthly averaging of the raw data. Let’s do the same in our Python code.
Calculating steps per month
We have a different number of samples for each month so we can’t just divide each month’s total step counts by a fixed number. Luckily, the iPhone records the date and time of each sample. We can use this information to group each sample by its corresponding month. The monthrange function from Python’s calendar library tells us the number of days in each month, which we’ll use to divide steps by days to arrive at an daily average for each month.
from datetime import datetime
from calendar import monthrange

steps_per_month, month_labels = [],[]
current_month = datetime.strptime(all_step_dates[0][:7], '%Y-%m')
running_step_count = 0
for n, date, step_count in zip(range(len(all_step_dates)), all_step_dates, all_step_counts):
    new_month = datetime.strptime(date[:7], '%Y-%m')

    if new_month > current_month or n == len(all_step_dates)-1:
        # How many days are in the current month?
        if date==all_step_dates[-1]:
            days_in_month = int(date[8:10])
        else:
            days_in_month = monthrange(current_month.year, current_month.month)[1]

        # Average step count for current month
        steps_per_month.append(running_step_count/days_in_month)
        month_labels.append(current_month.strftime('%b-%Y'))

        # Reset the running step count and current month
        current_month = new_month
        running_step_count = step_count
    else:
        running_step_count += step_count

# Convert to numpy arrays
steps_per_month = np.array(steps_per_month)
month_labels = np.array(month_labels)
So what’s it look like if we plot the monthly averages we’ve calculated?
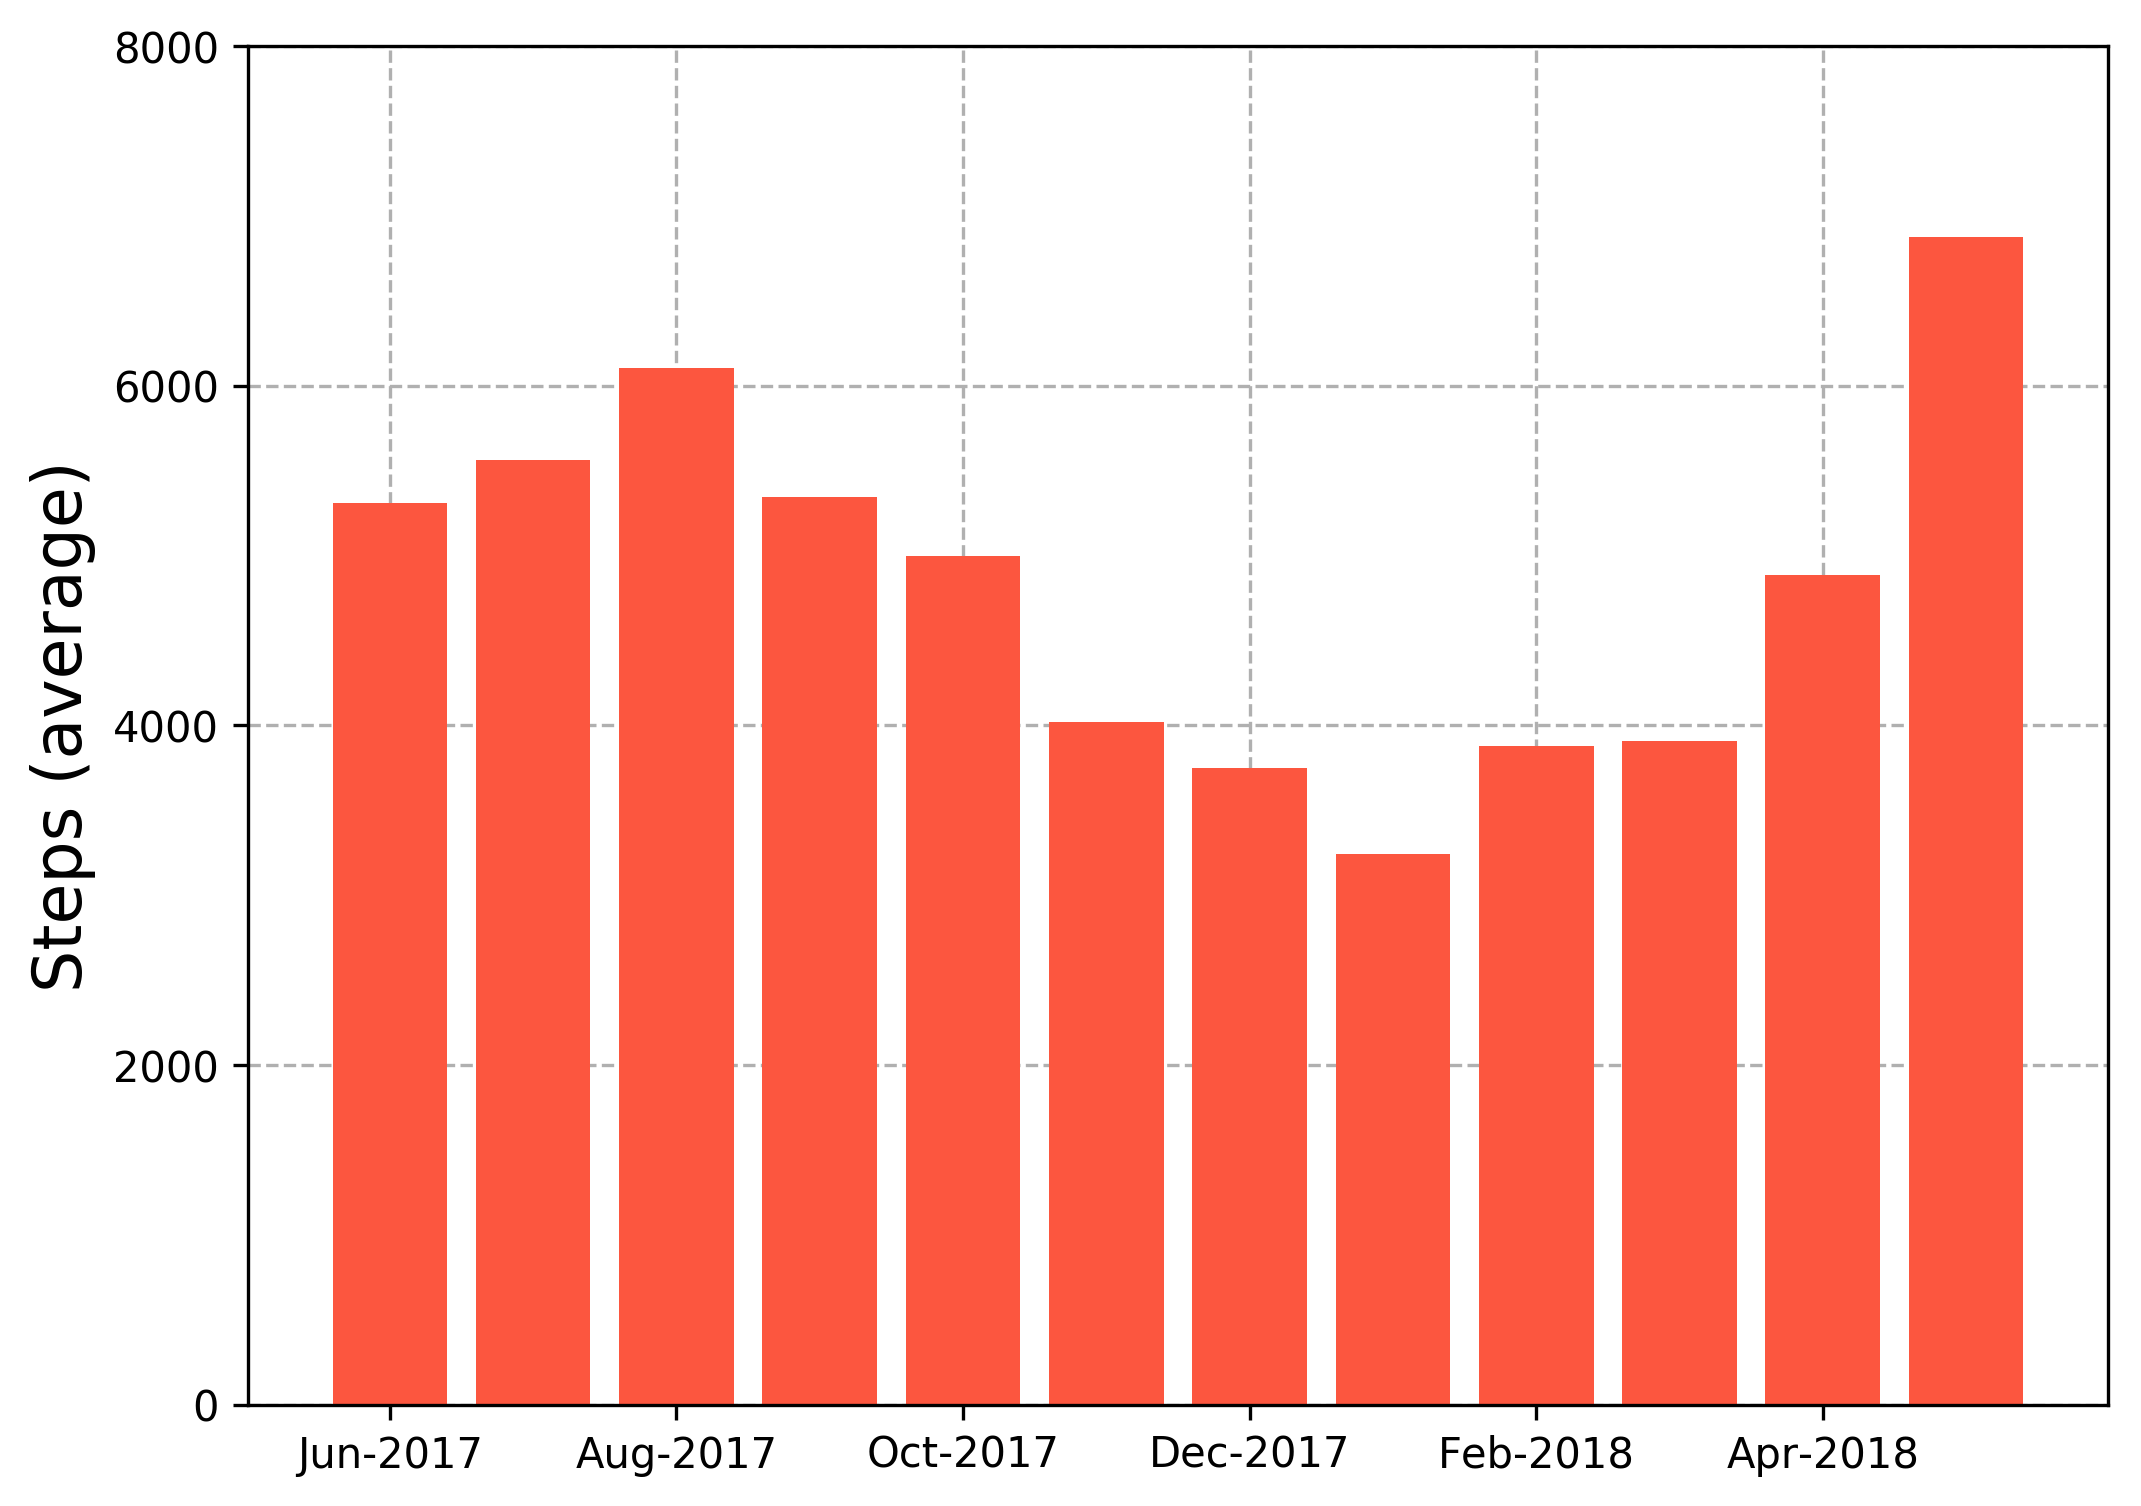
That’s more like it! If you compare this plot to the one generated by the iPhone above, you’ll see that they are essentially identical. Now that we’ve finished this sanity check and know that we’re properly handling the data, we can move on to more interesting analyses.
As I mentioned at the top of this post, I wanted to export and analyze my step count data because I had started to notice a relationship between daily activity level and the weather in Iowa City, where I live. I scraped the average monthly temperatures for Iowa City over the last year and plotted them on top of my average daily step counts for each month.
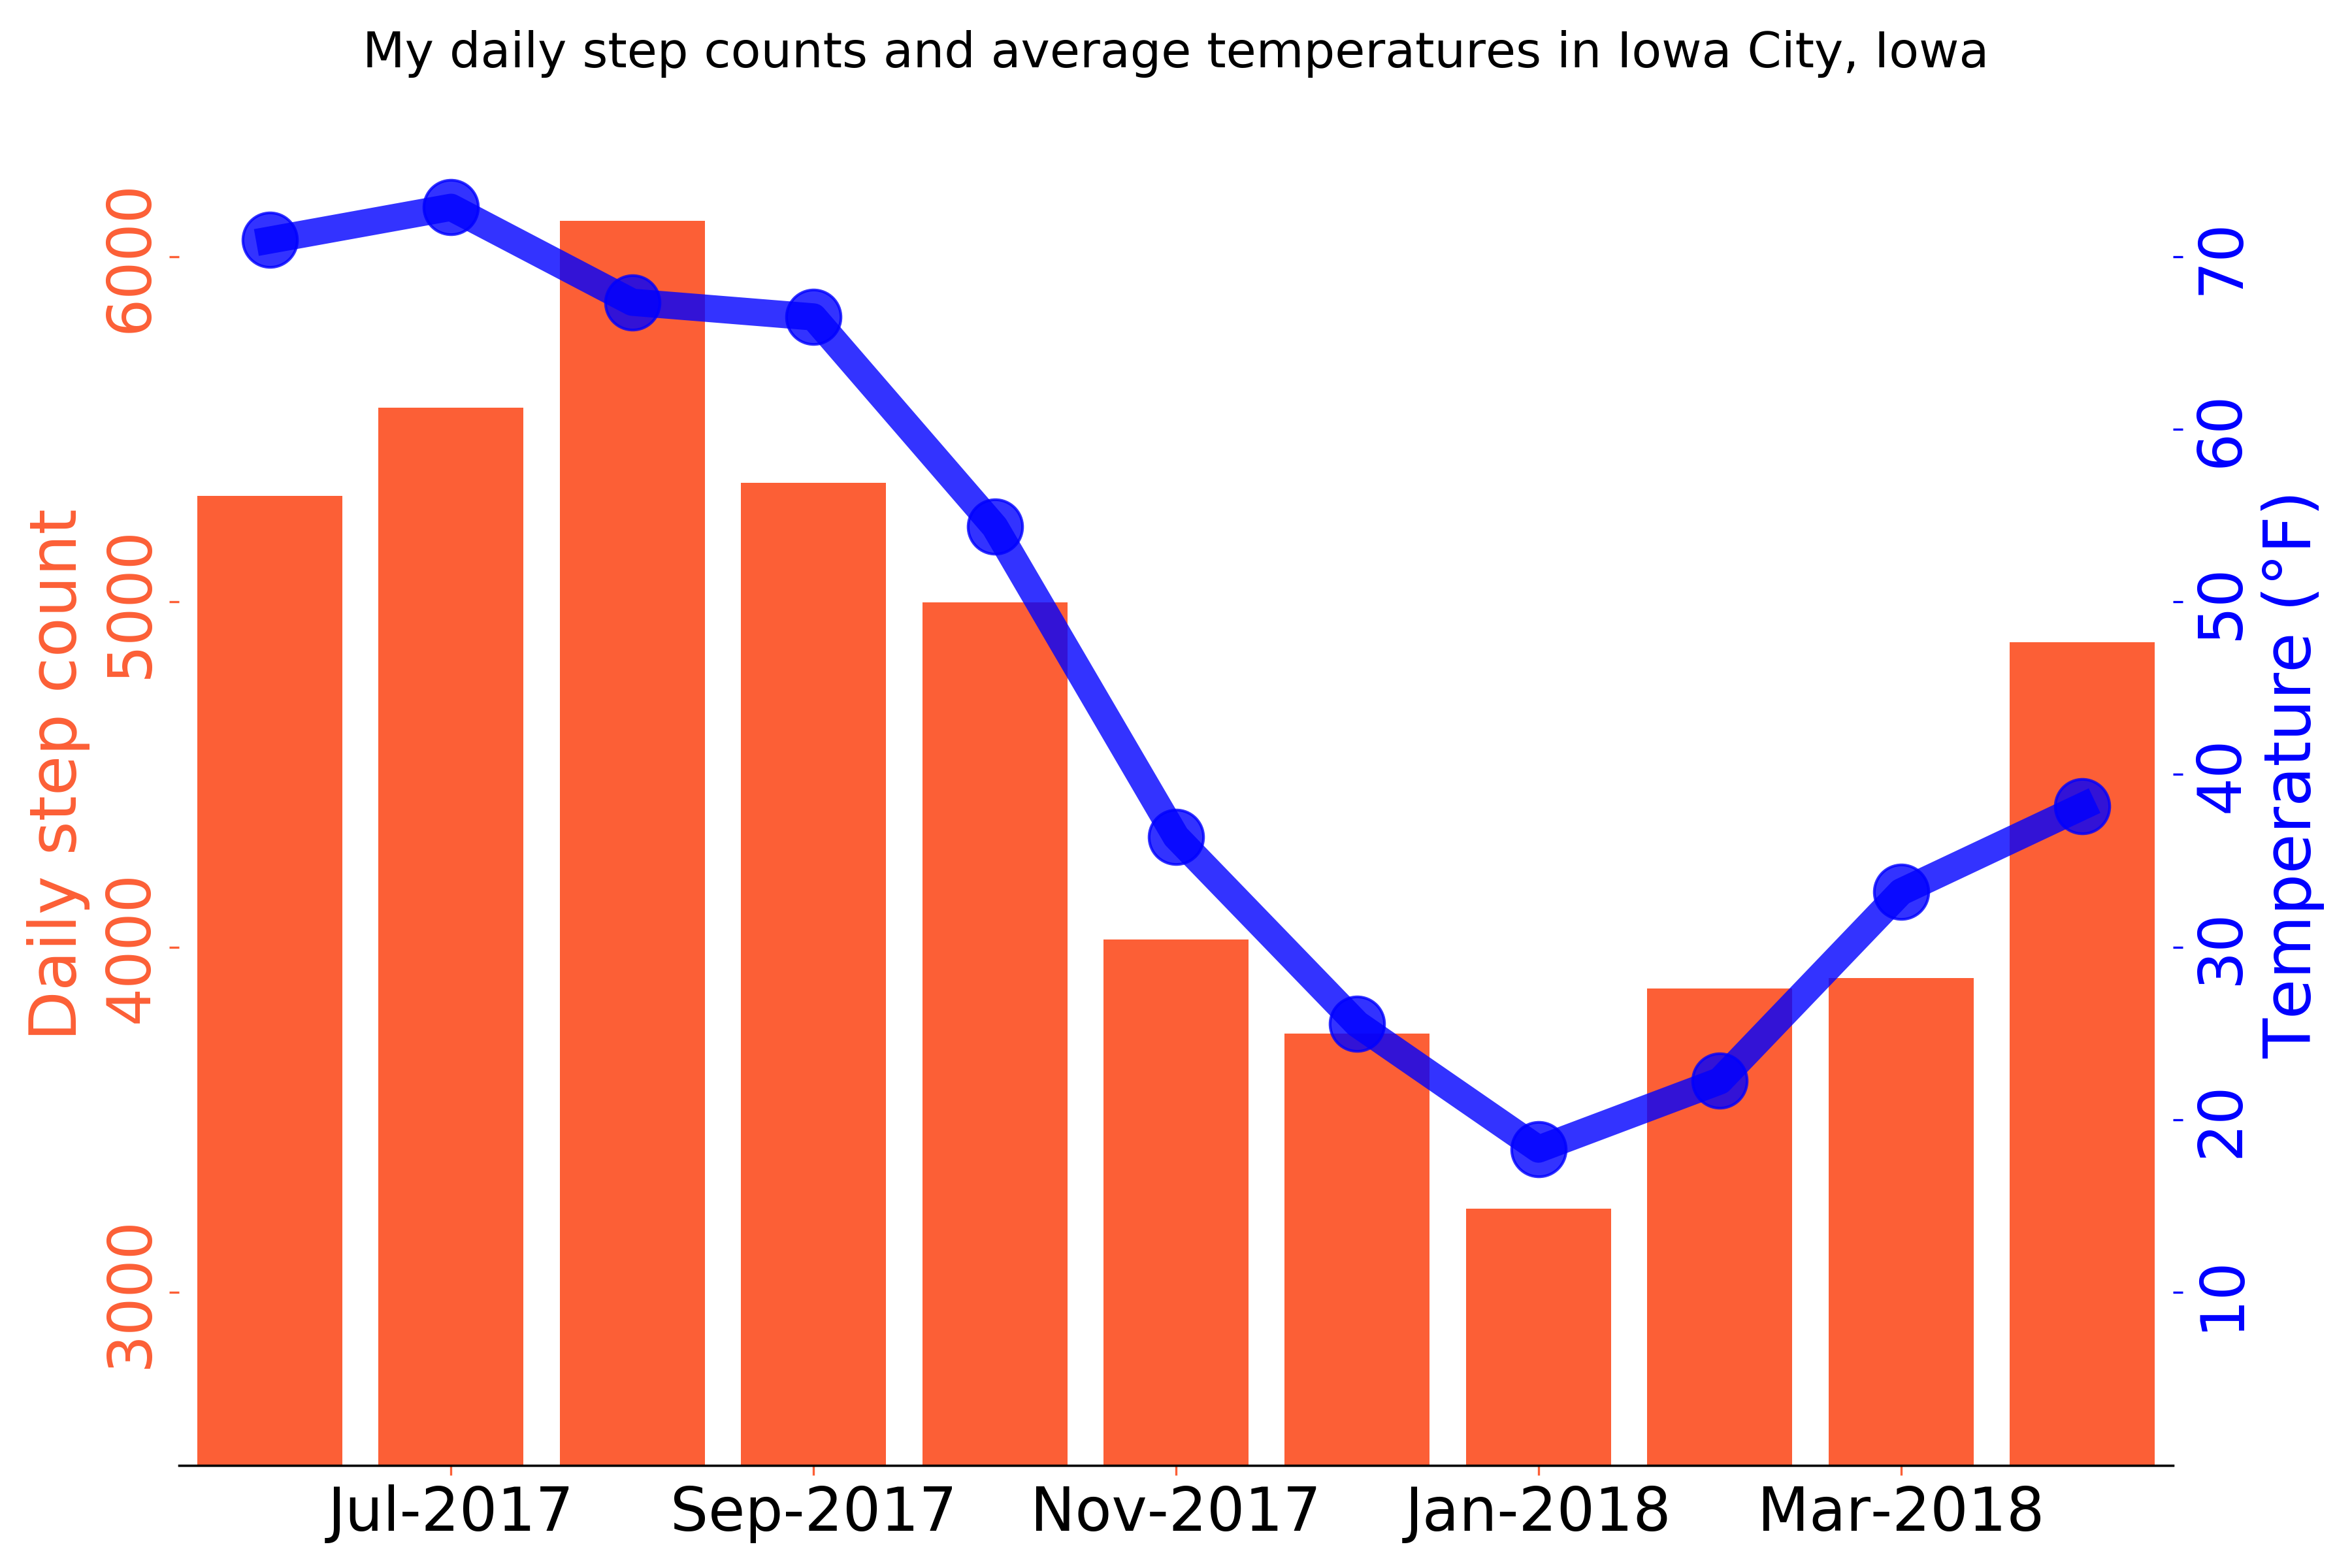
As somebody pointed out in my post on /r/dataisbeautiful, I either take fewer steps when it’s cold out, or my daily activity levels are having a serious affect on local weather patterns. The code for the above plot is contained within the same GitHub repository I linked to above.
Summary
By this point you should be able to export raw data from Apple’s Health app on iOS and produce a plot of the step counts in Python. Let me know in the comments section below if you have any questions or comments!

John
Perpetually inquisitve Data Scientist.