2018 FIFA World Cup ⚽️
We’re in the midst of the 2018 FIFA World Cup. I’ve wanted to play with some sort of sports-related data for a while, so I figured now is as good as a time as any to start.
Collecting the data
I’ve been trying to get more practice interfacing with APIs, so I was hoping to find a soccer API rather than simply a precompiled dataset. After doing some Googling for World Cup APIs, I came across the Sportradar API. Sportradar provides 15 APIs for soccer data alone. Luckily, they provide a free trial for the APIs that allows a total of 1,000 queries.
I wrote a Python package that makes it easy to interface with the Sportradar APIs. The code is available on GitHub. The easiest way to get started is to install the package using pip:
$pip install sportradar
After pip finishes the installation you can use the package to download World Cup data.
from sportradar import Soccer

# Create an instance of the Sportradar Soccer API class
sr = Soccer.Soccer("paste your api key here")

# Get a list of all tournaments
tournaments = sr.get_tournaments().json()

# Get info on the 2018 World Cup (Teams, Rounds, etc.)
worldcup = sr.get_tournament_info(tournaments['tournaments'][4]['id']).json()

# Get more information on each team in the World Cup
teams = []
team_counter = 0
for group in worldcup['groups']:
    for team in group['teams']:
        team_counter += 1
        team_id = team['id']
        team_name = team['name']
        print("({}): {}, {}".format(team_counter, team_name, team_id))
        try:
            teams.append(sportsradar.get_team_profile(team_id).json())
        except Exception as e:
            print("Error: {}".format(e))
        time.sleep(5) # wait 5 seconds before next API call

# Save the team data to a .json file
print("Saving the data...", end="", flush=True)
with open("world_cup_team_data.json", "w") as outfile:
    json.dump(teams, outfile)
print(" Done.")
And now we have the data we need! Definitely take a look at Sportradar’s API documentation to get a sense for what all is available (e.g. NBA, NFL, other soccer tournaments, etc.).
Visualizations
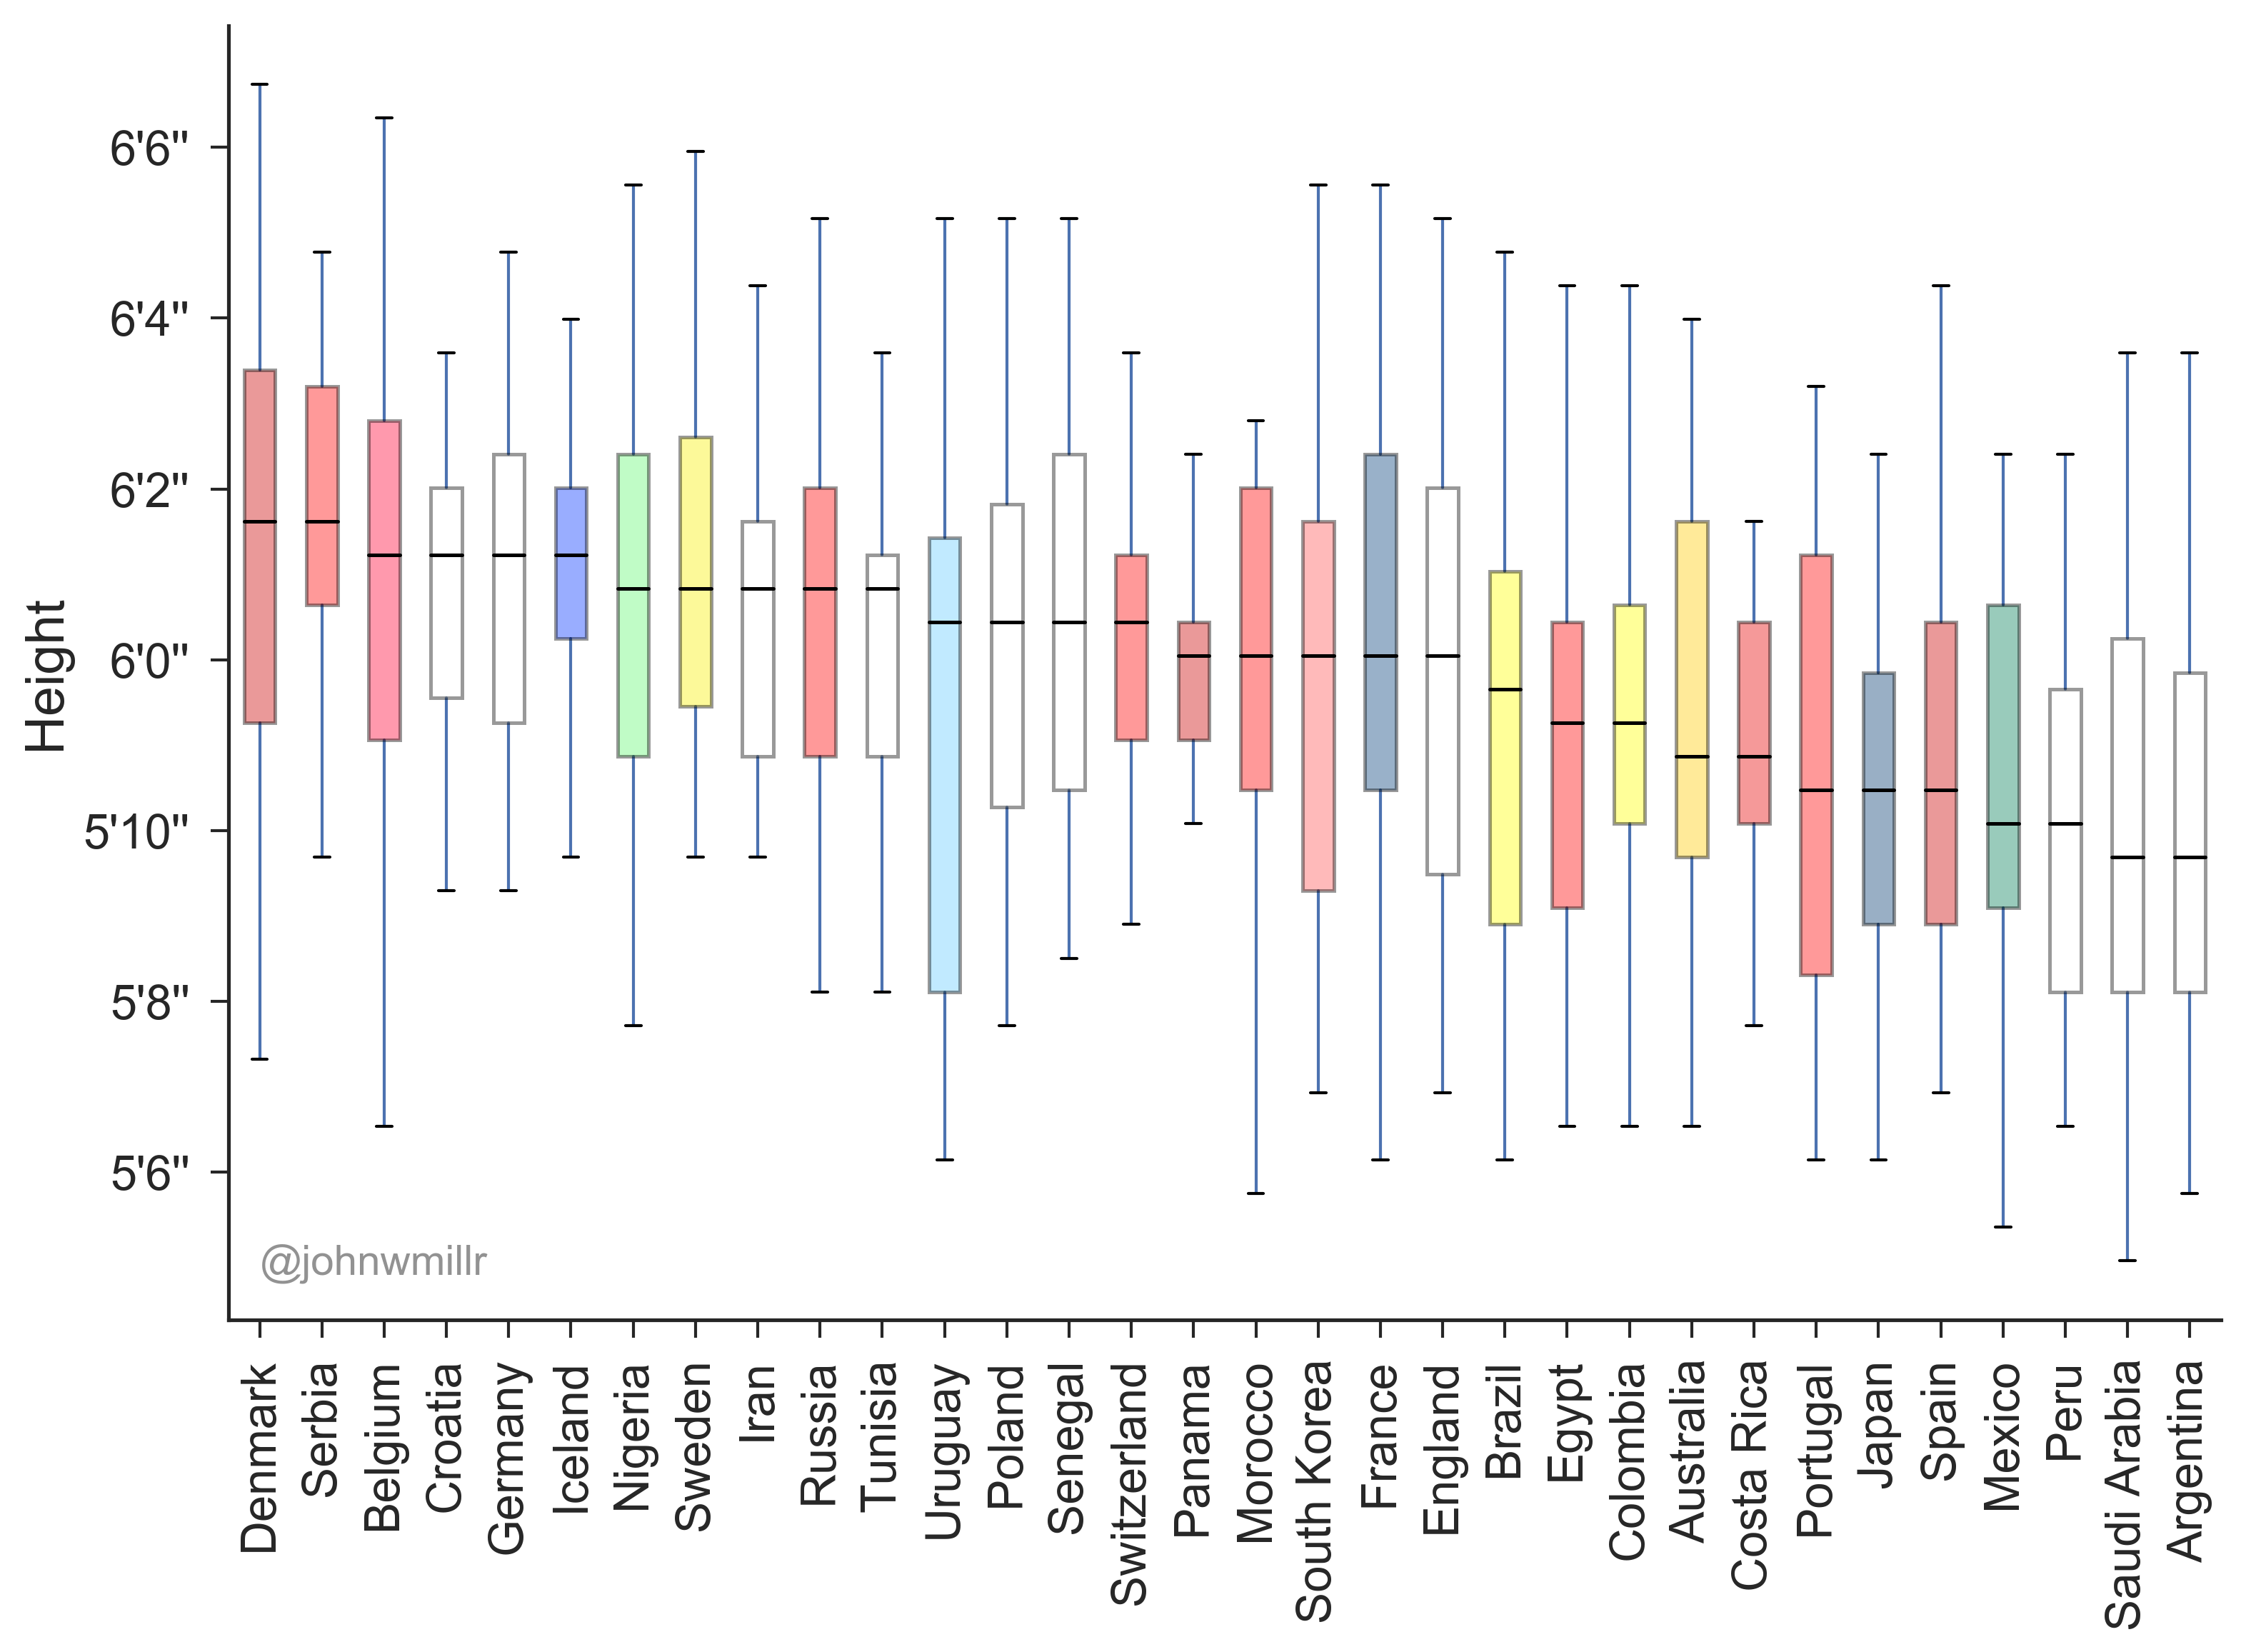
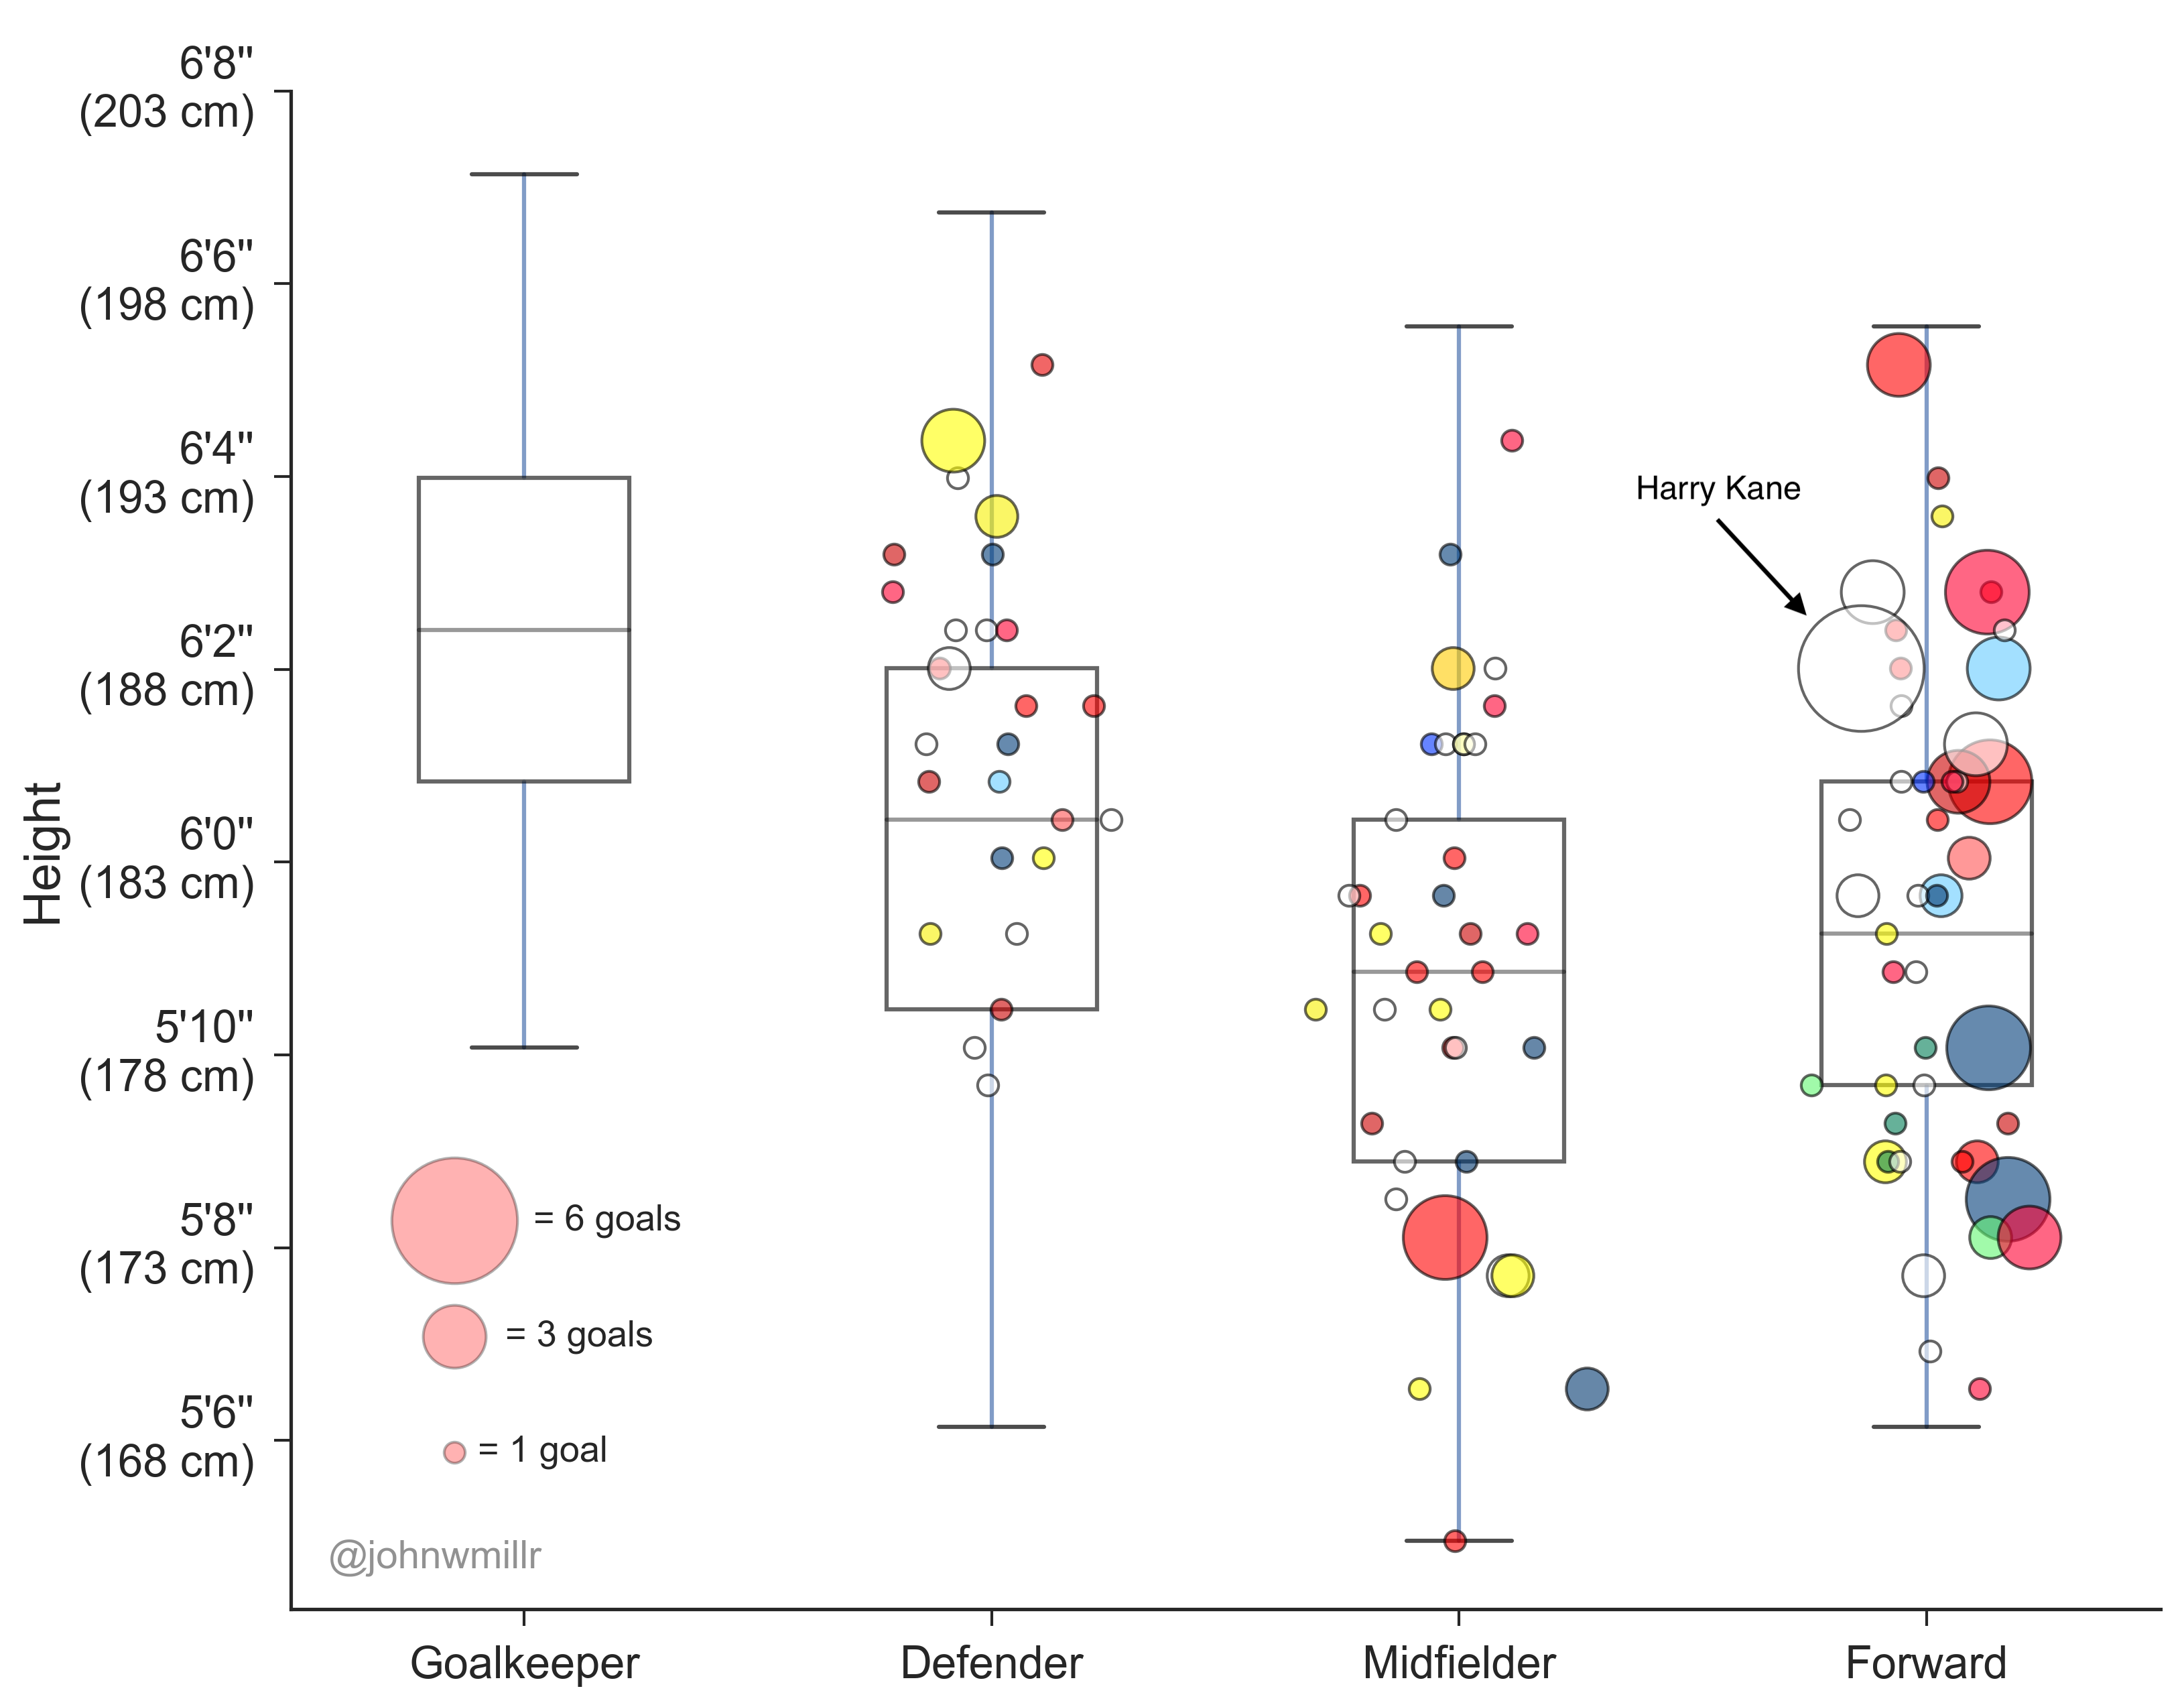
Below are some of the plots I’ve made using the World Cup data. For each of the box-whisker plots, the middle line indicates the median of the team’s height distribution. The edges of the boxes extend to the first and third quartiles of the data. The whiskers extend to show the range of the data, excluding any extreme outliers. You can find the code I wrote to generate these plots on GitHub.
Distributions of player height sorted by country
Distributions of player height sorted by position
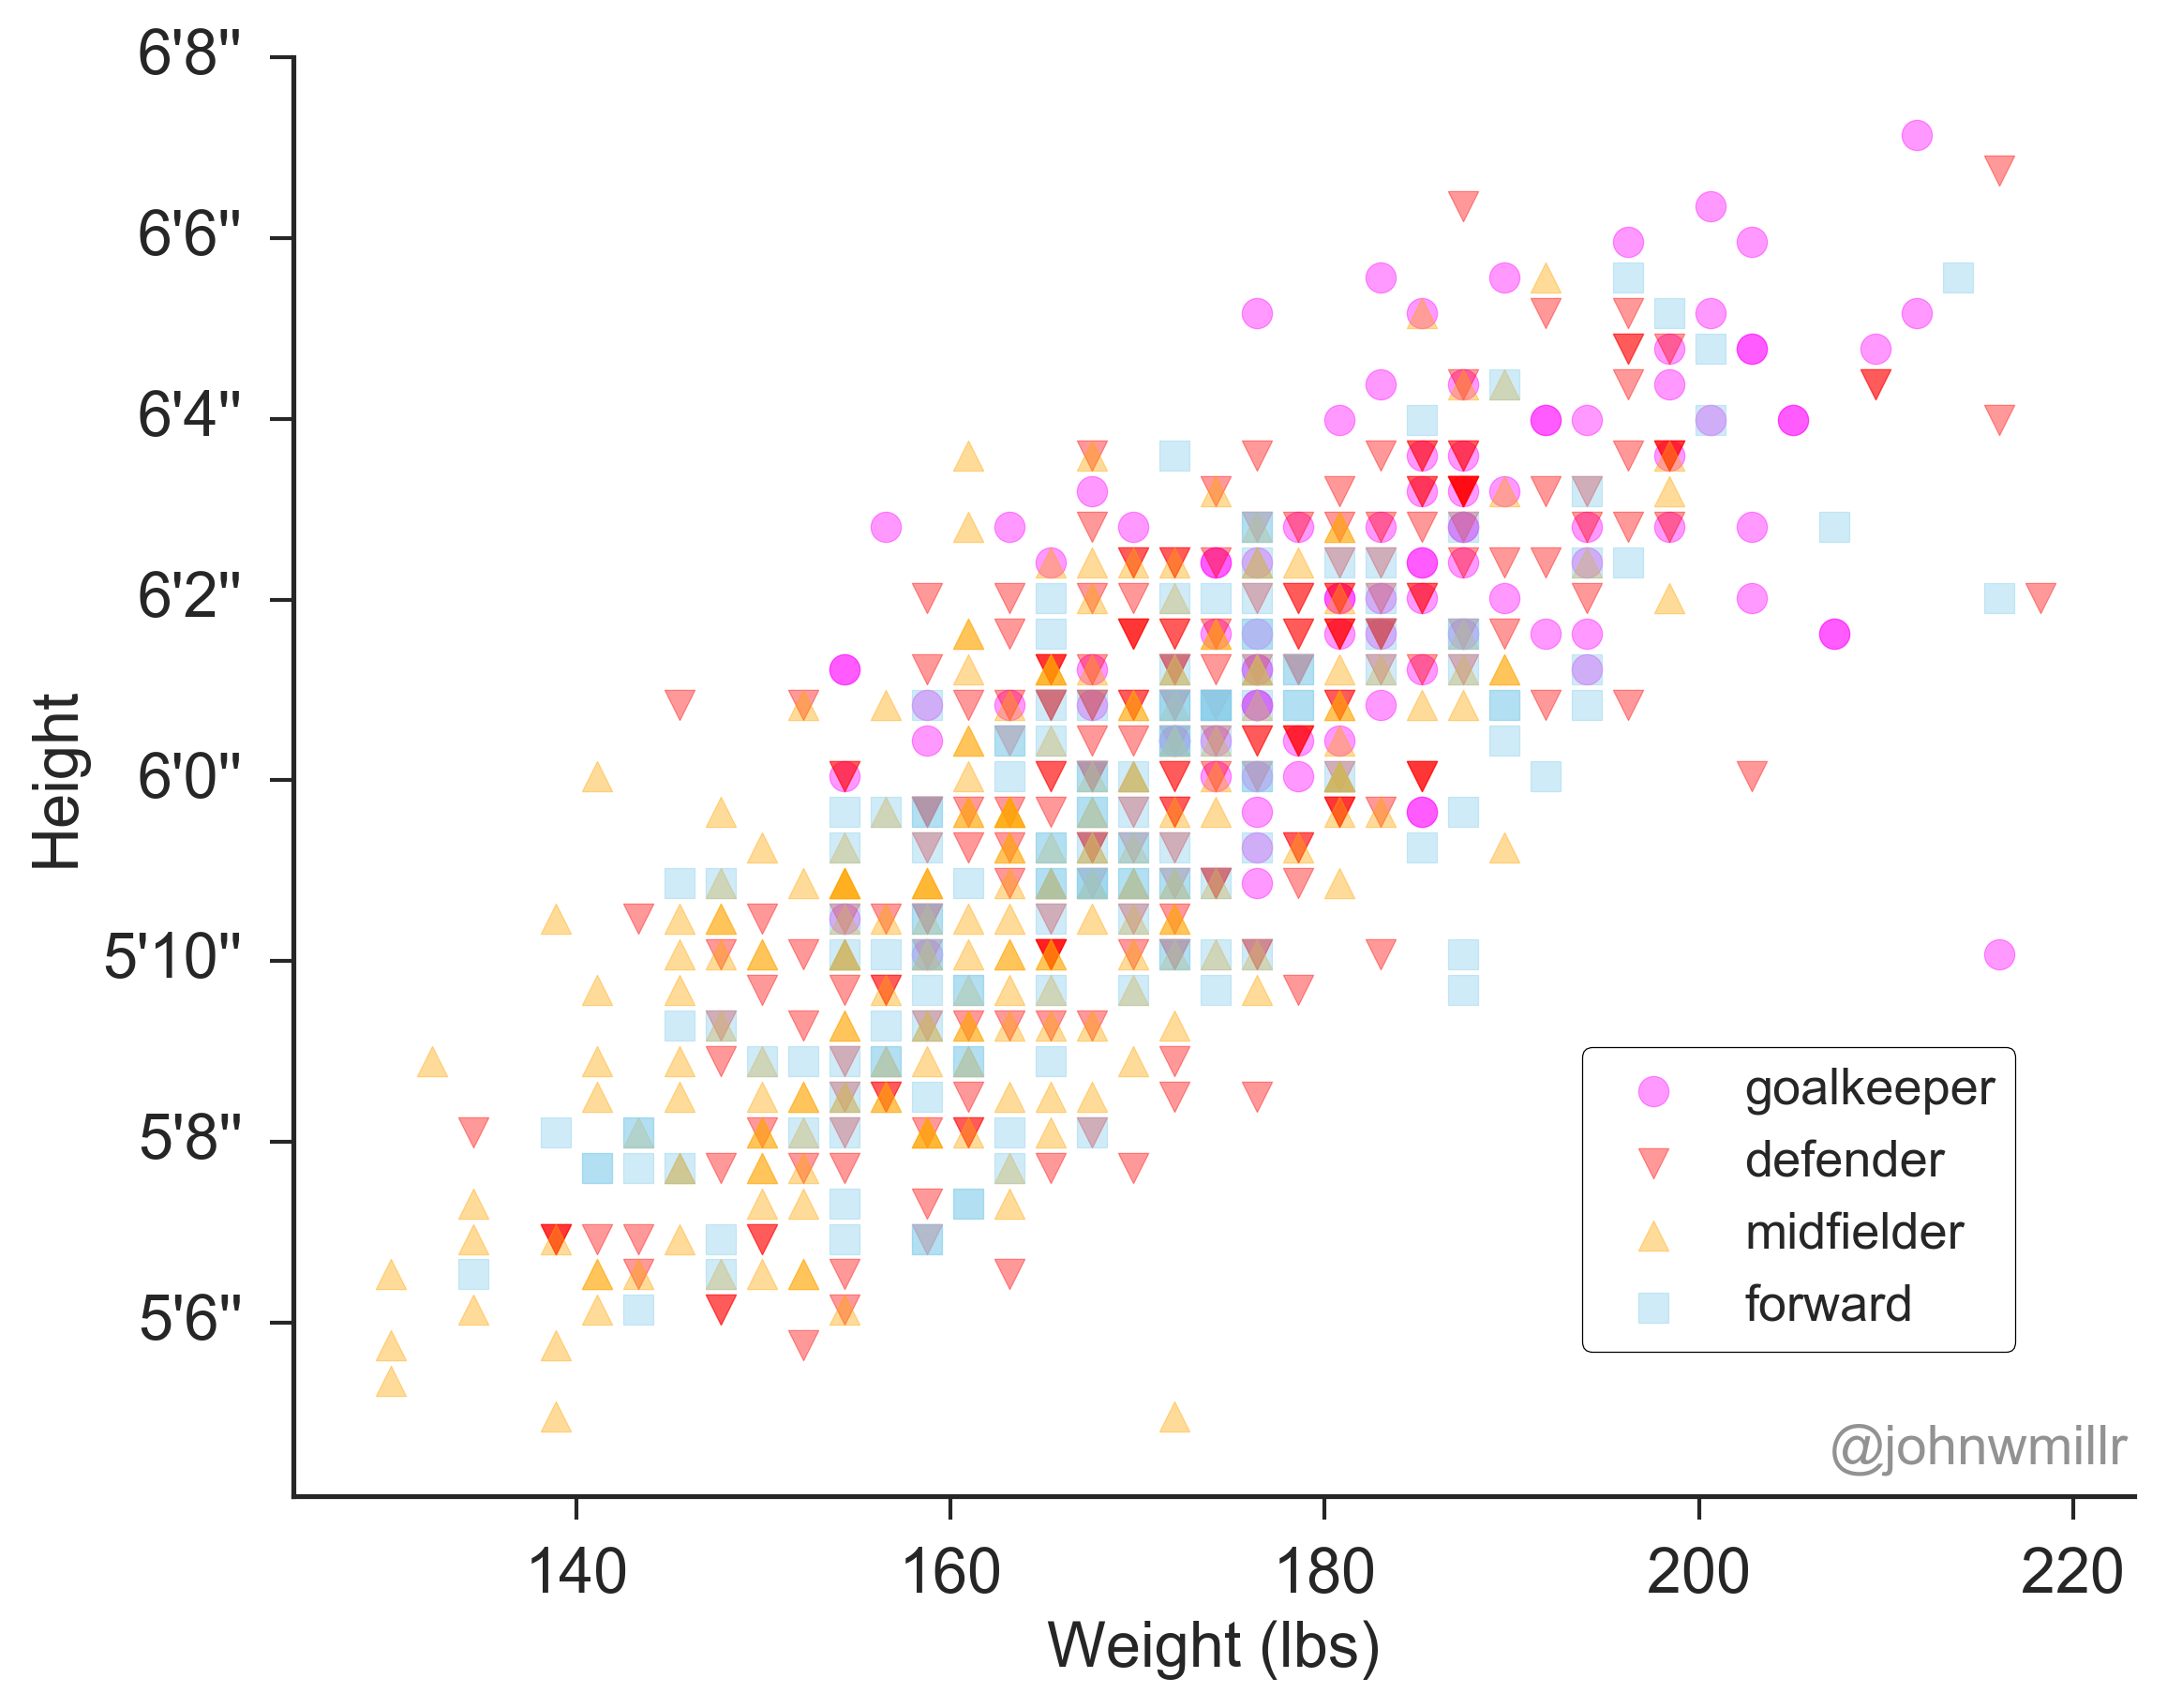
This is an interactive plot. Move your mouse over the scatter plot points to see details on each player.
This plot did quite well on /r/dataisbeautiful, although people were pretty upset I didn’t use metric units.
Player heights and goals scored
Height vs. weight by player position

John
Perpetually inquisitve Data Scientist.